INCIDENT RESPONSE TOTALS FOR PAST YEARS
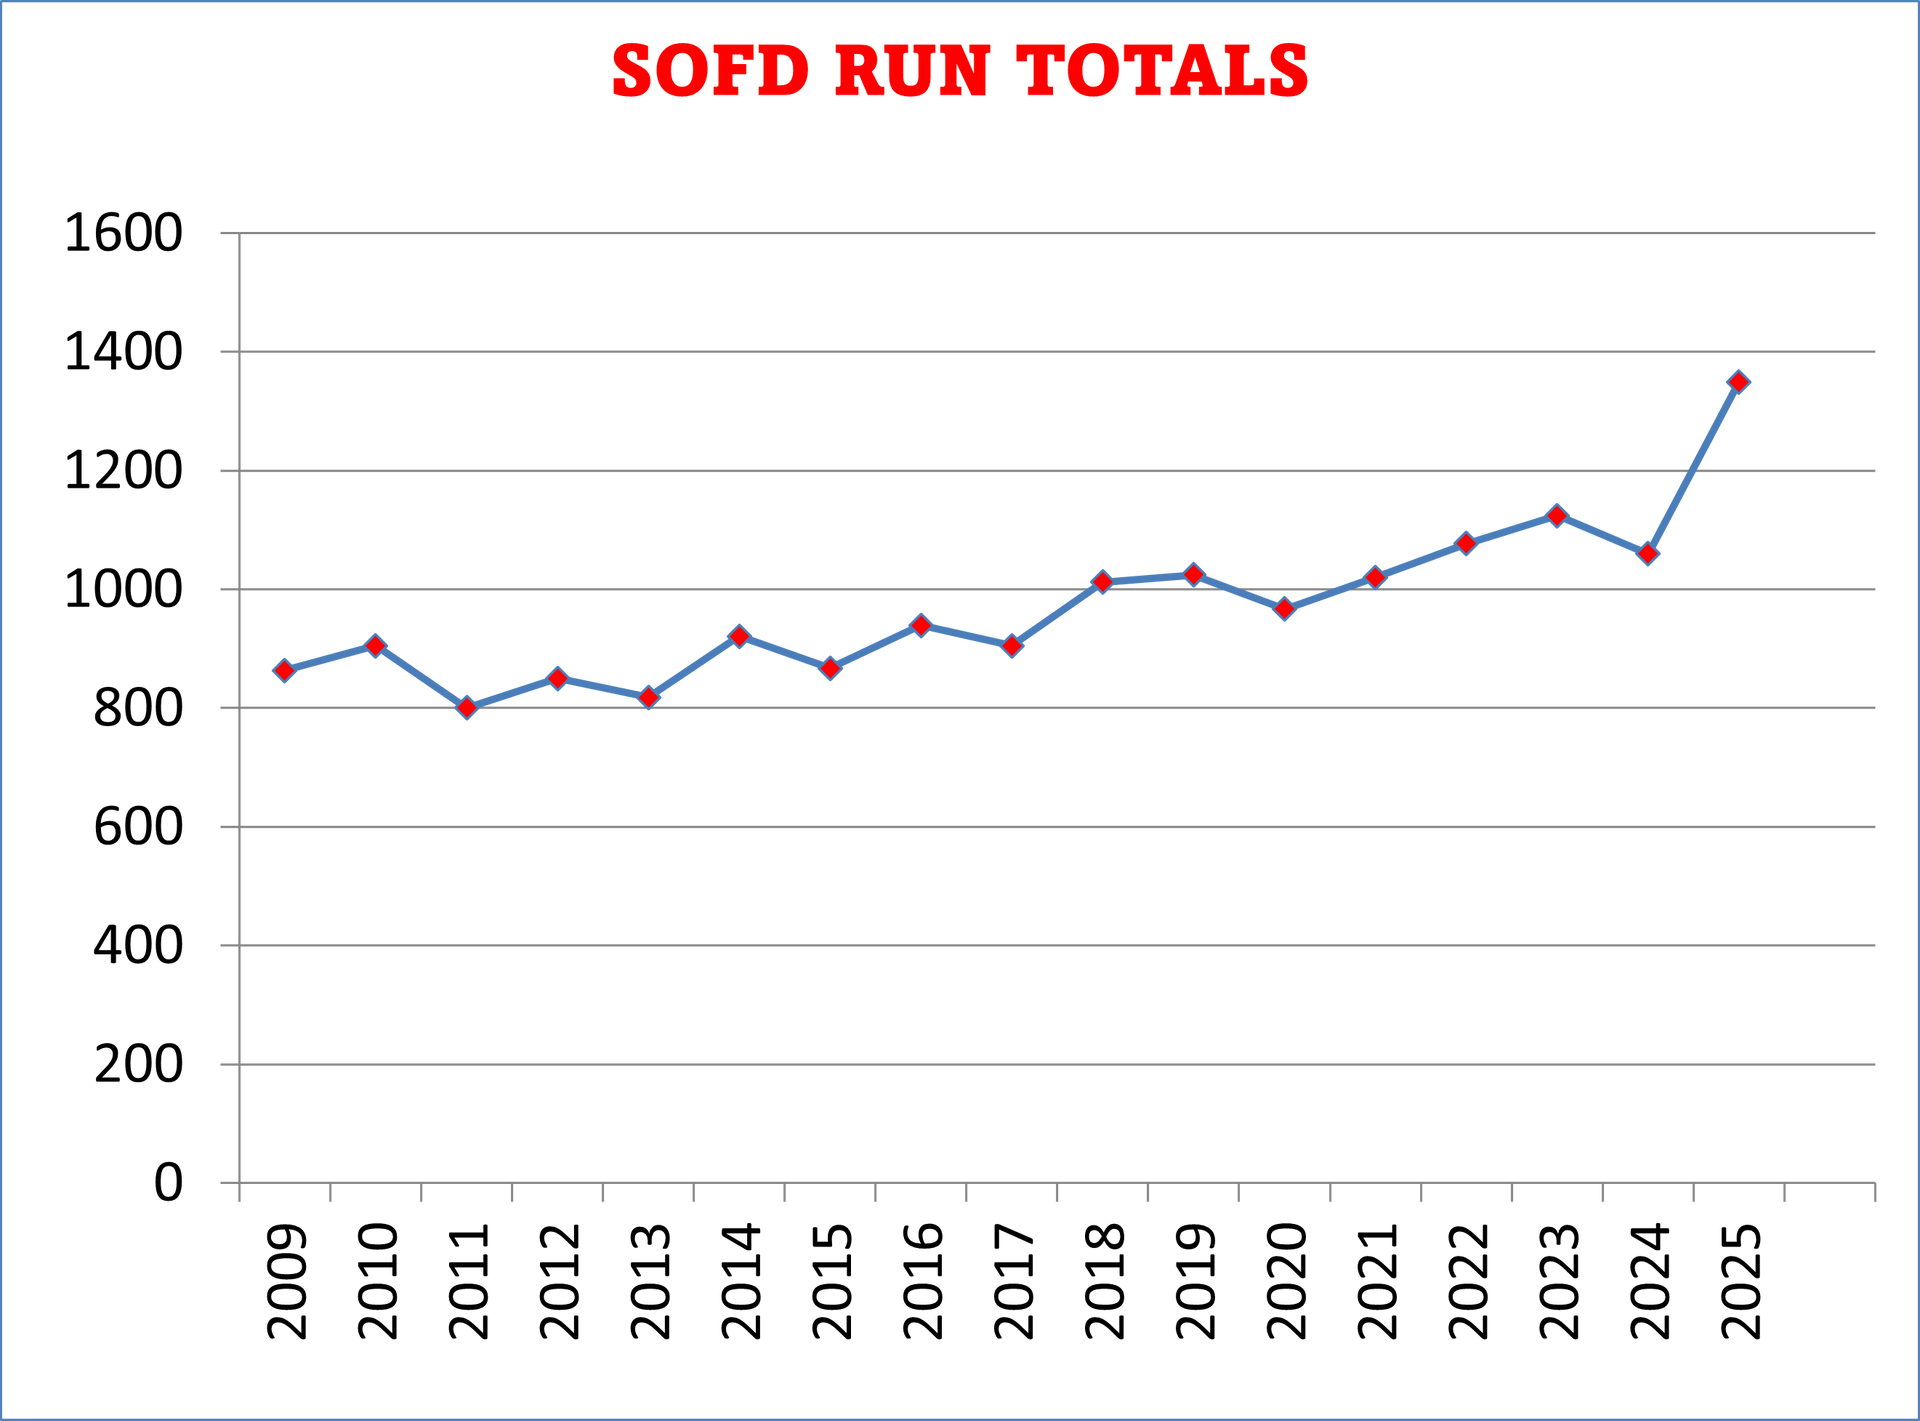
| 2009 = 863 | 2010 = 905 | 2011 = 800 | 2012 = 850 |
|---|---|---|---|
| 2013 = 818 | 2014 = 921 | 2015 = 867 | 2016 = 939 |
| 2017 = 905 | 2018 = 1,012 | 2019 = 1,024 | 2020 = 967 |
| 2021 = 1,020 | 2022 = 1,077 | 2023 = 1,123 | 2024 = 1,060 |
| 2025 = 1349 | 2026 = 461 |
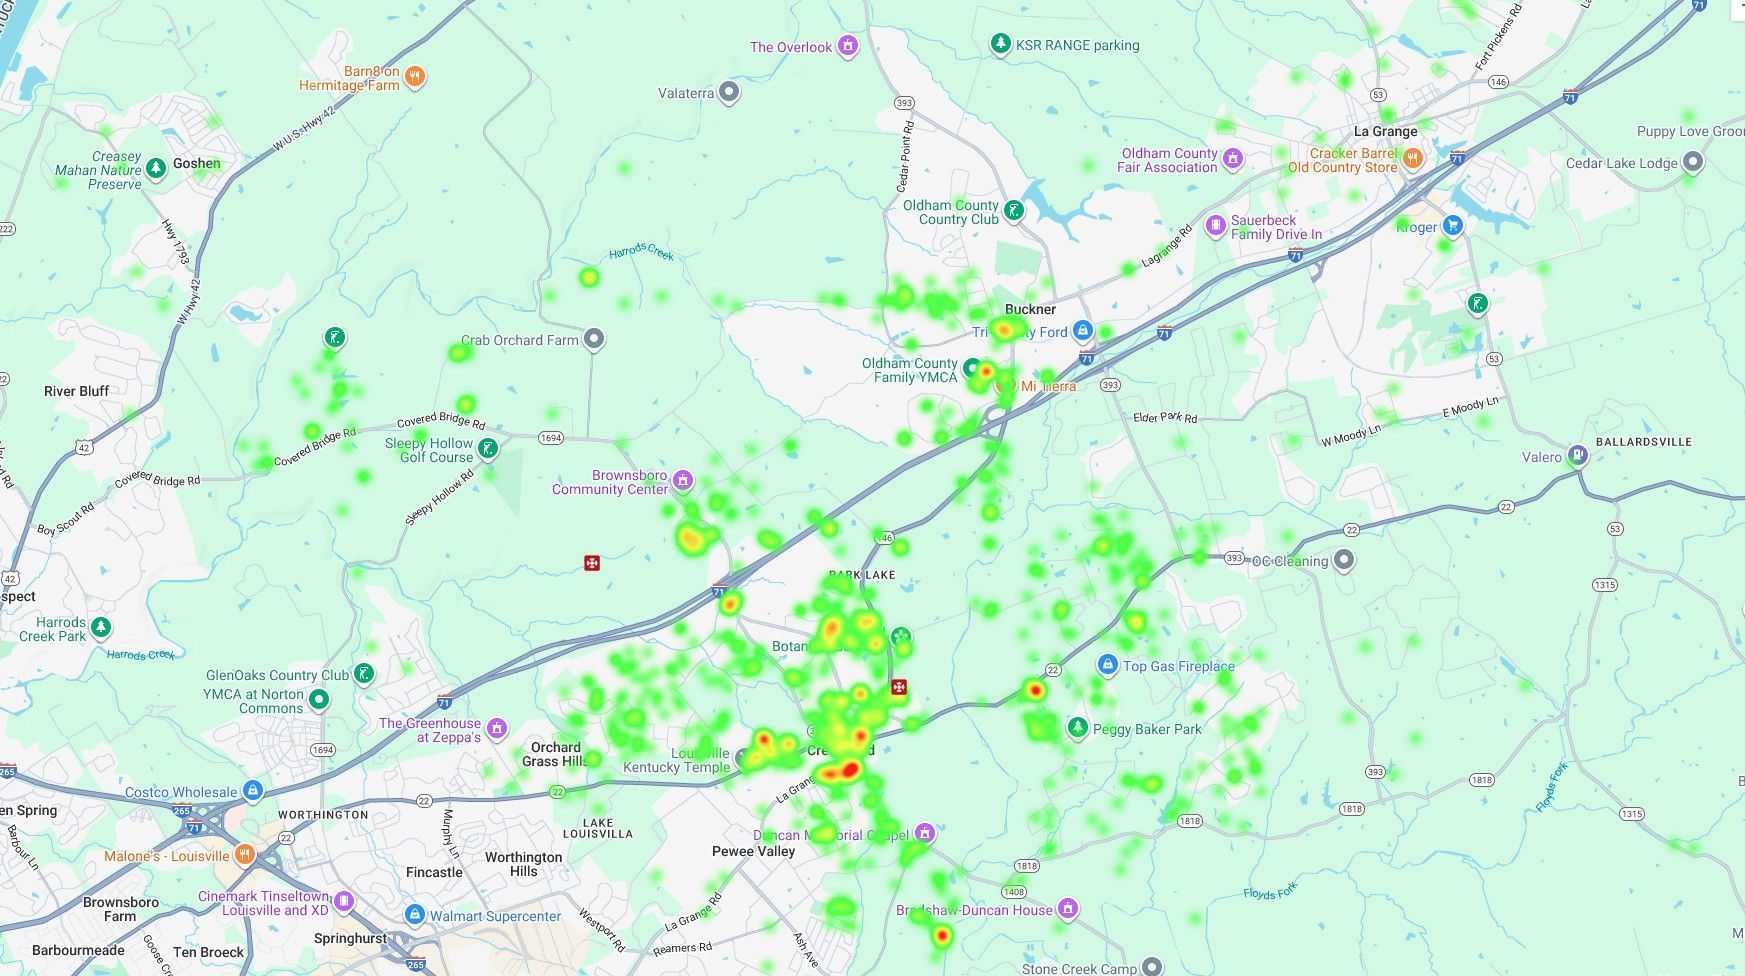
Year to Date Incident Heat Map
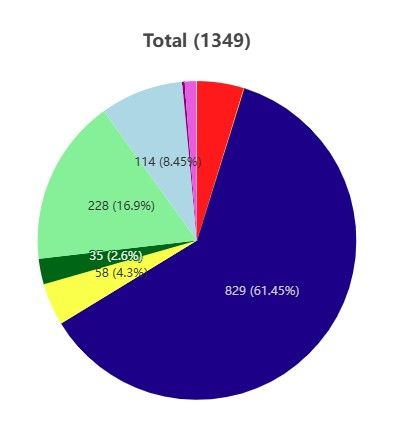
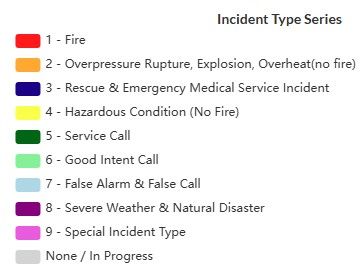
2025 INCIDENT RESPONSE TYPE BREAKDOWN